Targeted Proteomics Data
AMP PD Targeted Proteomics Release 4.0 features a unified, bridged data product (designated as D03) designed to streamline cross-cohort analysis. This normalized release was generated from earlier Release 3.0 datasets, "D01" and "D02," using Olink's R bridging scripts. It combines longitudinal samples from the NINDS Parkinson’s Disease Biomarkers Program (PDBP) and the Michael J. Fox Foundation’s Parkinson’s Progression Markers Initiative (PPMI). To ensure proper normalization and inter-cohort compatibility, researchers are strongly encouraged to utilize this bridged Release 4.0 product for analyses involving both datasets.
Dataset Scope and Formats
The bridged D03 release encompasses 3,050 total CSF and plasma samples from 413 participants. The dataset consists of eight unfiltered NPX files covering four targeted Olink 1536 proteomics panels: Cardiometabolic, Inflammation, Neurology, and Oncology. Data is organized by tissue source (CSF, Plasma) and release version (D03), and is provided in long, matrix, and olink-explore formats to support standard bioinformatics pipelines as well as Olink-specific analysis tools. Within the foundational Release 3.0, Dataset D01 includes 746 samples from 213 participants, while Dataset D02 includes 666 CSF samples.
Quality Control and Analysis Resources
Release 4.0 has been reformatted to incorporate AMP PD-specific participant and sample identifiers, facilitating immediate integration with existing cohort metadata. Specialized Quality Control (QC) columns have been added to provide clear visibility into technical flags and pass/fail statuses. To support user analysis, the release includes detailed sample metadata sheets and specialized Terra notebooks. These resources range from "Getting Started" guides for assigning case/control statuses to advanced tutorials for technical QC evaluation and data visualization. For technical inquiries, researchers can reference the data-specific README files or contact admin@amp-pdrd.org.
What's on this page:
| Baseline | 3M | 6M | 9M | 12M | 18M | 24M | 30M | 36M | 42M | 48M | 54M | 60M | 72M | 84M | 96M | Total | ||
|---|---|---|---|---|---|---|---|---|---|---|---|---|---|---|---|---|---|---|
| PDBP | Plasma | 111 | 0 | 2 | 0 | 91 | 28 | 114 | 0 | 110 | 0 | 48 | 0 | 17 | 0 | 0 | 0 | 521 |
| CSF | 111 | 0 | 2 | 0 | 91 | 28 | 114 | 0 | 110 | 0 | 48 | 0 | 17 | 0 | 0 | 0 | 521 | |
| PPMI | Plasma | 263 | 26 | 125 | 9 | 128 | 24 | 166 | 26 | 94 | 18 | 148 | 15 | 55 | 7 | 5 | 1 | 1120 |
| CSF | 244 | 5 | 111 | 0 | 109 | 0 | 152 | 1 | 84 | 0 | 133 | 1 | 43 | 0 | 5 | 1 | 888 |
Sample Selection Criteria
The criteria used to select these samples were as follows:
- Samples for three timepoint or more available
- Participant samples selected were from participants who had previously generated corresponding Whole Genome Sequencing or Transcriptomic data on the AMP PD Knowledge Platform
- All CSF samples selected had hemoglobin < 100 ng/mL to assure limited blood contamination
- All Plasma and CSF samples were collected under similar protocols
AMP PD Quality control of the preview release data was performed by Victoria Dardov from Technome as part of a contract with the Foundation for the National Institutes of Health (FNIH).
Information here was prepared by the Olink Proteomics in consultation with the AMP PD Proteomics Working Group.
Method
Proximity Extension Assay for Targeted Proteomics

Normalized Protein Expression (NPX) quantifies the relative amount of a specific protein. This is determined by performing an immunoassay for a targeted protein. Antibodies that bind to a protein of interest contain unique sequences that are extended, amplified and subsequently detected and quantified by NGS. The amount of this sequence is normalized to standard plate controls to give relative quantities of targeted proteins.
Assay Controls Summary
Extensive quality control is performed for each assay in order to control and assess technical performance of the assay at each step. This ensures generation of reliable data.
AMP PD Controls
AMP-PD quality control further examines the data and includes sample, run and control sample QC.
Generating NPX values
The Explore system´s raw data output are NGS counts, where each combination of an assay and sample is given an integer value based on the number of DNA copies detected. These raw data counts are converted into NPX values for use in downstream statistical analysis.
Assay Controls
Converting Counts to NPX
The Explore system´s raw data output are NGS counts, where each combination of an assay and sample is given an integer value based on the number of DNA copies detected. These raw data counts are converted into NPX values for use in downstream statistical analysis.
NPX generation and Normalization
The NPX values are calculated in two main steps and then intensity normalized by performing between-plate-normalization. First, the assay counts of a sample are divided by those of the extension control for that sample and block, which then undergoes log2 transformation to normalize the data:
Steps in the NPX generation described in equation form, where “i” refers to a specific assay, j refers to a sample, and ExtNPX defines an extension normalized NPX value.

- Relate counts to a known standard (Extension control)
- For all assays and all samples, including negative controls, Plate Controls, and Sample controls.
- Log2 transformation gives more normally distributed data
The result is a scale that has increasing sample values against increasing protein concentration for each assay. The median of the Plate Control is then subtracted from the normalized data:

- Perform plate standardization
- For all assays and per plate of samples
Intensity normalization of data is the default for randomized studies on multiple sample plates. In this setting, the median for a random selection of samples is more stable across plates than the three PC’s on each plate. Intensity normalization sets the median level of all assays to the same value for all plates:

- Between plate normalization (Optional but the default for multi-plate projects)
- For each assay, for all plates in the project.
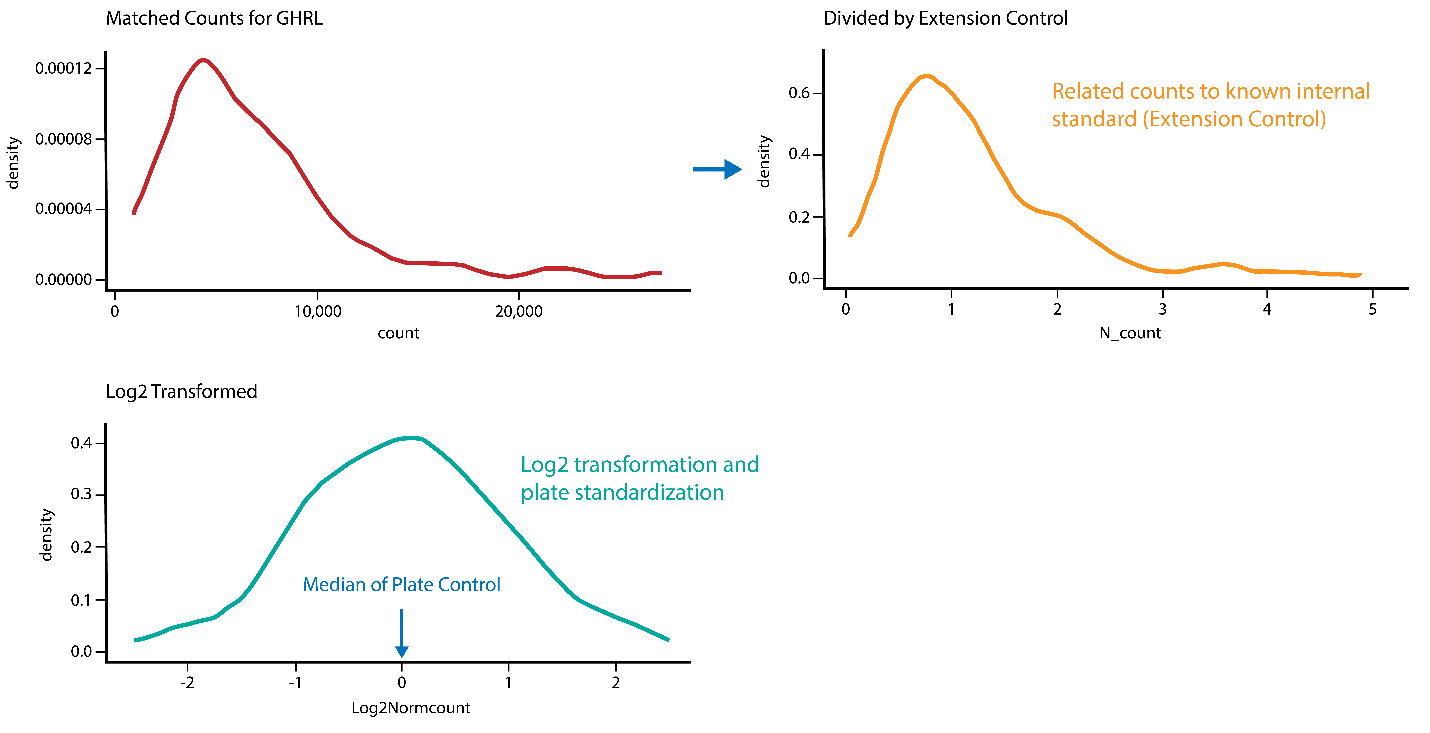
Figure 1: Summary of the three steps involved in NPX generation and data normalization. Step 1 is illustrated by the red graph, step 2 by the yellow graph, and step 3 (data normalization) by the turquoise graph. GHRL refers to appetite-regulating hormone (Uniprot ID: Q9UBU3).
AMP PD Quality Controls
LOD and CV Calculation
LOD is defined as being three standard deviations above the median NPX of negative controls. The median is set using all samples annotated as negative controls per plate. A predefined standard deviation is used (fixSD). Detectability is calculated per assay and plate and is defined by the percentage of samples above the LOD threshold. The overall detectability of the project is generated and reported in the CoA:
The CV is calculated per assay (i) using the assumption of a log-normal distribution. The average CV is then calculated across panels and included in the CoA output.

Bridging Datasets Methodology
Inclusion of Bridging Samples:
The final goal was to perform a joint analysis of datasets D01 and D02, and it was recommended to use common samples in the two batches that could help with batch correction to remove technical variation between the runs. Olink recommends the inclusion of 16-24 of these “bridging samples” across runs and the protein levels measured for these samples can be used as a common reference between batches, used to normalize and alleviate any potential bias. In this experiment, 39 samples from the D01 batch were included as bridging samples with the D02 dataset. These samples were selected using the dplyr R package to find the intersecting samples between D01 and D02 datasets. This list of overlapping samples was used as part of the olink_normalization_bridge_function from the Olink Analyze R package.
Bridging Data and QC
The bridging procedure involved the calculation of the median of the paired NPX differences per assay between the bridging samples. This is the assay specific adjustment factor which is used to adjust NPX values between all remaining samples in the two datasets. In this process, the D01 dataset was considered the reference dataset and its NPX values remained unaltered. The D02 dataset was adjusted to the reference dataset based on the adjustment factors.
In some cases, the bridging led to the duplication of the same sample x uniprot with two separate NPX values. In addition, there are cases in which there is a duplicate uniprot ID due to the same uniprot ID being in more than one Olink panel or there being two different Olink assays that map to that uniprot ID. In all of these cases, the mean NPX value was calculated and used in the final data product, resulting in one NPX value for every uniprot ID for every sample ID.
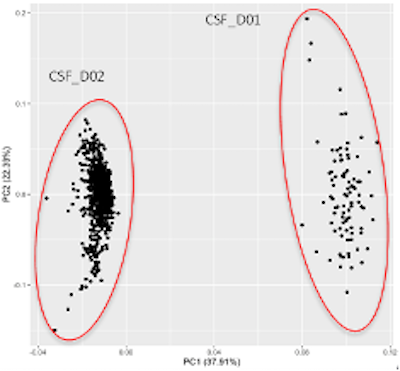
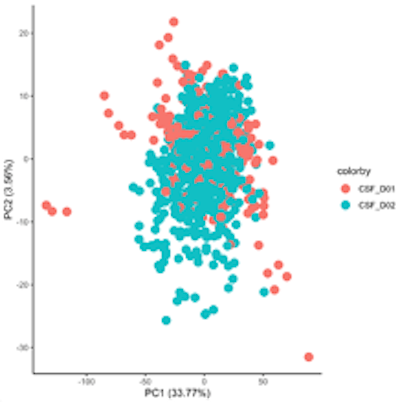
The bridging and mean calculations were all conducted using R and were performed separately for cerebrospinal fluid data sets and the plasma data sets. Results of the bridging can be seen below through PCA. Figure 1a shows dataset D01 and D02 prior to bridging. Separation along PC1 shows datasets D01 and D02 as distinct, with 37.91% of the variation due to batch effects. Figure 1b shows that after performing bridging, D01 and D02 no longer show separation along PC1, indicating that bridging was successful and batch effects were removed.